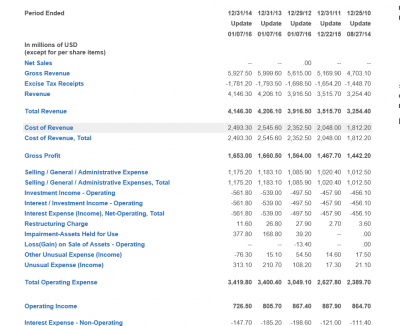
MolsonCoors has been the buzz of the brewing industry in recent months due to their full acquisition of MillerCoors. This is a big step in expanding their market share in the industry. I intend to examine its recent financial statements to pull out some factors of its cost structure and see if its cost structure is relevant to this recent acquisition.

Revenues for the first time in five years have decreased, but only by a small margin of 1.4%. Since the creation of its subsidiary MillerCoors in 2007 revenues and total operating expenses have risen by similar percentages. As Molson Coors’ revenue has increased it needed to expand operation increasing related costs yet retained increased profits throughout. Since 2010 total profit has increased 14% which points to their success in the market. What I found to be really interesting is that the growth in revenues (27%) was nearly double the increase in costs (14.7%).
In November of 2015 it was announced that Molson Coors planned to buy out the remaining 58% of shares of Miller Coors from SAB Miller. This acquisition alone didn’t show if Molson Coors was doing well or SAB Miller was in hot water, or another situation altogether. However, I believe that this data at least points to the dominance of Molson Coors in recent years and can support the first scenario.
In terms of cost structure this financial statement does leave some ambiguity. Without fully disclosing the raising of prices or changes in output, the truth about their change in cost structure is dependent upon further research. From personal observations, prices of all products both in Molson Coors and Miller Coors have remained consistent over the years. That said, it can be hypothesized that this increase in revenue has resulted in increased output and purchasing from consumers.
In its press release for investors of the Miller Coors acquisition Molson Coors touted a figure stating a cumulative $1.33 billion in cost saving measures since 2005. Half of this savings was completed throughout 2005-2010, so the posted measurements since 2010 to not account for a majority of these cost saving measures. I cannot find the exact methods which this reduction in costs was accounted for given the available data, so again there exists some ambiguity on which variables accounted for this reduction over time.
Given Molson Coors increased profits and revenue over the past five years it is very clear how its acquisition was possible. While the exact changes in cost structure are unclear, it can be seen that Molson Coors believes that they are well equipped to manage Miller Coors fully in addition to its other endeavors. However, only time will tell if they can successfully manage all facets of its expanded company and continue to increase revenues in a similar fashion while maintaining similar methods of beneficial cost structuring.
Sources:
http://www.molsoncoors.com/en/index
TAP%20-%20MillerCoors%202015%20Investor%20Presentation%20FINAL%20.pdf
2 Comments
It was interesting to see how the increase in revenue correlated with the increase in cost. Just goes to show how expansion under the proper conditions can me highly profitable.
OK, but we should look at “real” values, for example the ratio of costs to sales. The cost of revenue has gone up from 56% to 60%, while the profit ratio fell in percentage point terms a corresponding amount. Now there are foreign exchange corrections and so on, so we should be cautious in interpreting this. In addition, are costs up in percentage terms because prices are lower or because costs of barley and the like are higher (or a bit of both). You have to work at the numbers to pull that out.
Comments are closed.