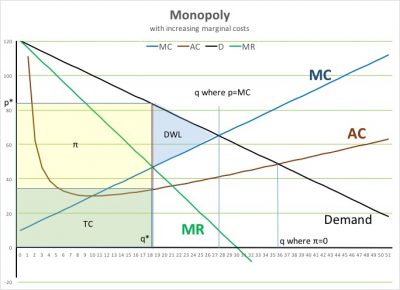
We developed the “perfect competition” model in class, without spending a lot of time on the background except to claim that we in general are NOT interested in it other than as a reference point. Competitive firms (think wheat farmers) have no choice over price, don’t undertake R&D or advertise, and in practice don’t view neighbors as competitors. They may better or less well run, but that’s not strategy.
We did note the concepts of “producer surplus” and “consumer surplus,” respectively the area between the supply curve and price, and between the demand curve and price. With PC there is no deadweight loss.
- p = MC (= MR)
- π = 0 (economic profits, not accounting)
- p = minimum AC
Then there’s monopoly. We have yet to discuss why there might be one, or any associated issues. But from an analytic perspective, the graphs and results will be identical whenever a firm sees its demand curve sloping downward, in other words, when there is some tradeoff [unlike under perfect competition] between price and quantity.
With a downward-sloping demand curve our various “nice” conditions under PC vanish.
- p > MC
- π > 0
- p > min AC
- DWL > 0
Algebra:
- D: p = a – bq
- so in (p,q) order the p-axis intercept is (a,0) and the q-axis is (0,a/b).
- MR: p = a – 2bq (twice as steep, intersects q-axis at midpoint)
- c = MC
- we really don’t need to consider cases where it slopes upward. empirically sometimes it does *in the relevant range* but sometimes (as with a thermal power plant) MC really is close to constant.
- π max requires MR = MC
- [π=TC-TR so dπ = MC-MR from definitions of marginal, and π max has dπ=0 so MR=MC. intuitively, if revenue is increasing faster than costs, you earn more profits by increasing output.]
- So c = MC = a – 2bq or q* = (a-c)/2b
- Hence by substitution in p = a-bq we find p*=(a+c)/b and in (p*-c)q*=π=(a-c)2/4b
- Think: does this calculation assume that FC=0? [does the level of fixed costs affect the choice of output? in math terms, what is the value of marginal fixed costs?]

For much of the term we can simply even further by setting MC=c=0 even if we keep FC=F at some positive value. That makes the graph even simpler.
Speaking of which, here is a graph that illustrates many of these issues. Contrary to practice the rest of the term, I have MC sloping up, because I used Excel to generate the graph and it is easier to see.